Position, Velocity, Time, Acceleration
Purpose
During this lab, we will determine the five kinematic quantities of a block sliding down a plane. We will better our measuring skills by using many different measuring apparatuses.
Theory
There are four kinematic equations. These equations are used to identify the five kinematic quantities (initial velocity, final velocity, acceleration, distance, and time). Velocity is the speed at which the object is moving. Acceleration is the rate at which the velocity of the object changes. Distance is the length of space being measured. Time is how long the experiment is measured.
Kinematic Equations
Vf = Vi + at
d = 1/2 (Vf + Vi) t
d = Vit + 1/2at^2
Vf^2 = Vi^2 + 2ad
Kinematic Equations
Vf = Vi + at
d = 1/2 (Vf + Vi) t
d = Vit + 1/2at^2
Vf^2 = Vi^2 + 2ad
Experimental Technique
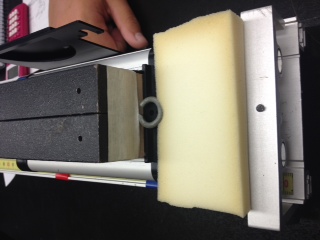
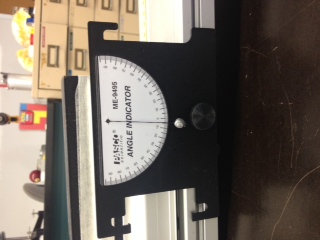
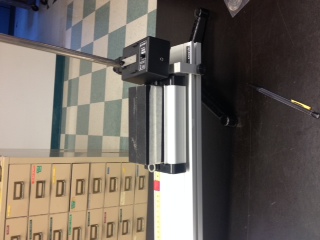
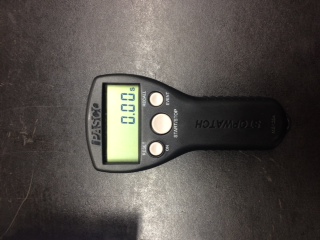
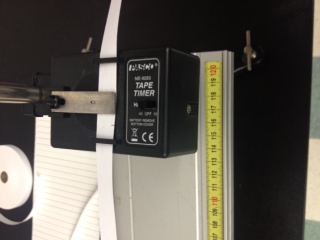
We will determine the five kinematic quantities. In order to do this, a variety of measurement tools will need to be used. The tools to be utilized include a stop watch, incline plane, ruler, ticker tape timer, tape, a sliding block, and the human eye. First, a sliding block was placed on an incline plane. The plane was at an incline of five degrees. Next, tape was placed at specific points on the incline plane to indicate a start and stop. Then, the block was timed rolling down the plane with the stop watch. An additional time was taken with the ticker tape timer. Using the four kinematic equations, the five quantities were found. The ticker tape timer results aided in producing graphs.
Data
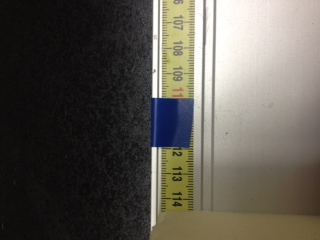
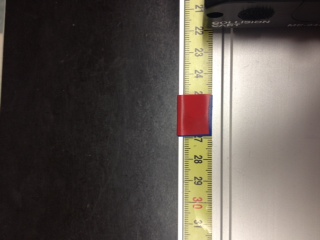
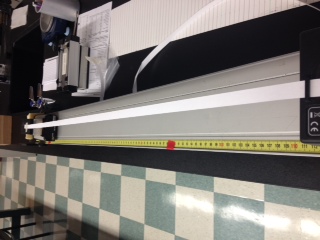
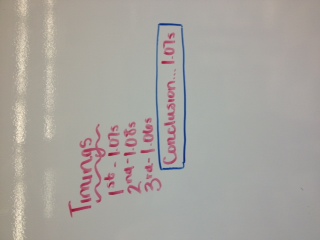
The plane was on an incline of five degrees. The distance the block slid was 85cm. The average time taken to slide was 1.07 seconds.


Analysis
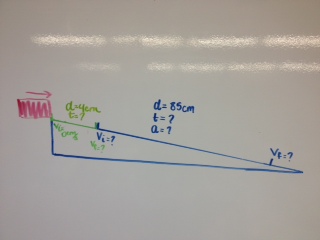
Information known before any experimentation.


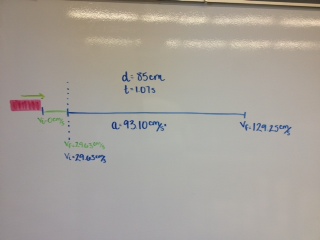
Final five kinematic quantites shown in blue.
Conclusion
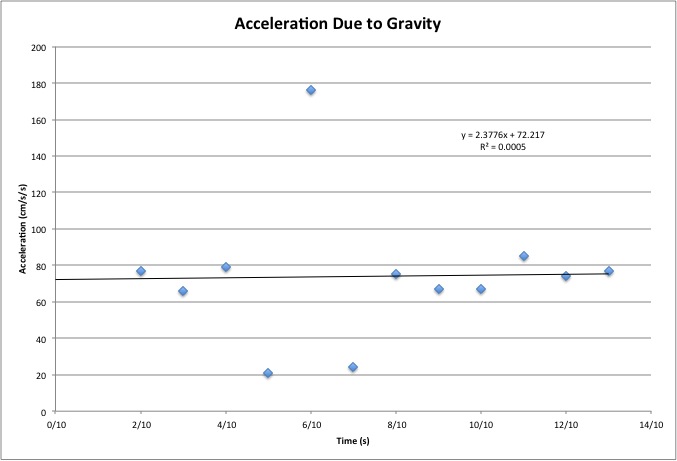
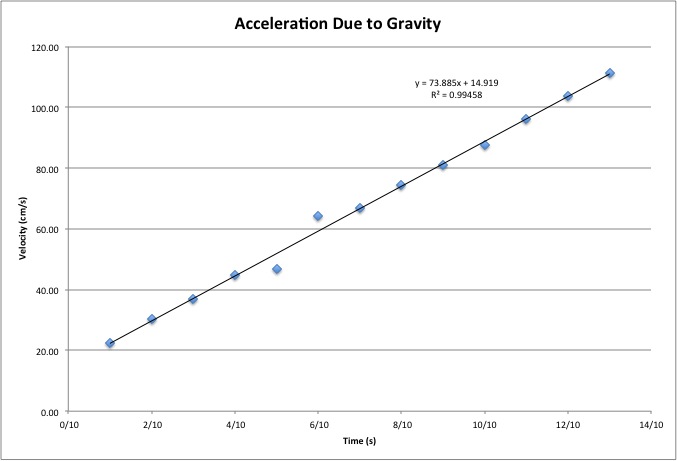
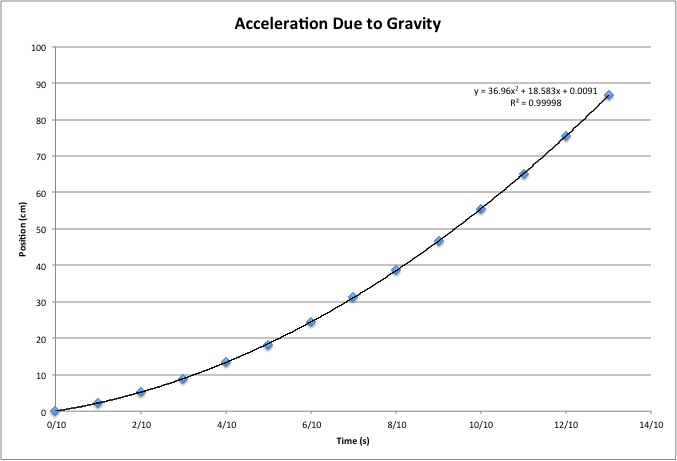
Our intentions were to find the five kinematic equations of a block sliding down an incline plane. The five quantities were found successfully although reaction time human error may have altered the results. The timings were an average because, due to reaction time, not all the timings were identical. Additionally, two graphs made sense while one did not. The velocity v. time graph and position v. time graphs increases at a relatively constant rate which both make sense. The acceleration v. time graph had no organization, there were points everywhere. Despite this, I am sure my measurement are mostly correct.
